import pandas as pd
import geopandas as gpd
import networkx as nx
import osmnx as ox
import matplotlib.pyplot as plt
import matplotlib.lines as mlinesSankey Chart and Road Map for Santa Monica data.

Data Source: Google Environmental Insights Explorer.
Modes in Santa Monica Road Network
Import Libraries
Download OpenStreetMap Data
# Define the place name or address
place = "Santa Monica, California, USA"

# Retrieve the road network for the place
G = ox.graph_from_place(place, network_type='all', buffer_dist=1000)

# Retrieve the boundary polygon for the place
boundary = ox.geocode_to_gdf(place)

# Plot the road network within the boundary
fig, ax = plt.subplots()
ox.plot_graph(G, bgcolor='w', edge_color='gray', node_size=0, ax=ax)
boundary.plot(ax=ax, edgecolor='black', facecolor='none', linewidth=2)
plt.show();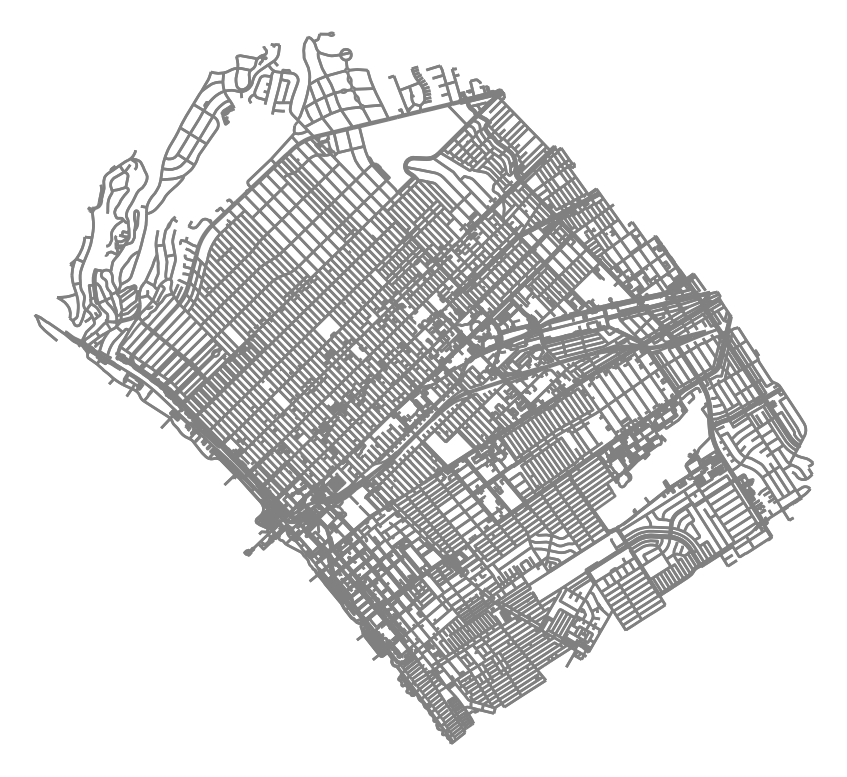
<Figure size 672x480 with 0 Axes>Acquire data as GeoDataFrames
# Convert the NetworkX graph to GeoDataFrames
nodes, edges = ox.graph_to_gdfs(G)

# Look at the data columns
edges.columns

# Look at counts per edge type
edge_types = edges['highway'].value_counts()
edge_types
footway 10472
service 9159
residential 7450
tertiary 2536
secondary 1346
primary 993
cycleway 336
unclassified 232
[steps, footway] 148
pedestrian 84
path 76
trunk 50
steps 42
motorway_link 38
secondary_link 31
[residential, service] 27
[residential, footway] 26
[path, footway] 16
motorway 15
trunk_link 13
[footway, service] 12
[service, footway] 12
tertiary_link 10
[residential, path] 10
[unclassified, service] 8
primary_link 6
[footway, pedestrian] 6
[steps, path] 6
[footway, cycleway] 4
[steps, residential, footway] 4
[steps, pedestrian] 4
[service, cycleway] 2
[steps, residential] 2
[steps, footway, corridor] 2
[residential, tertiary] 2
track 2
[track, footway] 2
[steps, path, footway] 2
Name: highway, dtype: int64# Generalize highway types
# https://wiki.openstreetmap.org/wiki/Tag:highway%3Dpedestrian
edges['highway'] = edges['highway'].apply(lambda x: ', '.join(x) if isinstance(x, list) else x)
edges['highway'] = edges['highway'].str.replace('footway|steps|pedestrian|corridor|track', 'path')
edges['highway'] = edges['highway'].str.replace('roads_link|motorway_link|trunk_link|primary_link|secondary_link|motorway_junction', 'roads')
edges['highway'] = edges['highway'].str.replace('motorway|trunk|primary|secondary|tertiary|unclassified|residential|service', 'roads')
edges.loc[edges['highway'].str.contains('roads'), 'highway'] = 'roads'
edges.loc[edges['highway'].str.contains('cycleway'), 'highway'] = 'cycleway'
edges.loc[edges['highway'].str.contains('path'), 'highway'] = 'path'
edge_types = edges['highway'].value_counts()
edge_types/var/folders/13/hf_sfnls1lq6kn8vsc92q40h0000gn/T/ipykernel_8329/3233845876.py:4: FutureWarning:
The default value of regex will change from True to False in a future version.
/var/folders/13/hf_sfnls1lq6kn8vsc92q40h0000gn/T/ipykernel_8329/3233845876.py:5: FutureWarning:
The default value of regex will change from True to False in a future version.
/var/folders/13/hf_sfnls1lq6kn8vsc92q40h0000gn/T/ipykernel_8329/3233845876.py:6: FutureWarning:
The default value of regex will change from True to False in a future version.
roads       21984
path        10862
cycleway      340
Name: highway, dtype: int64
Color-code roads by type
#https://stackoverflow.com/questions/63102436/coloring-edges-in-osmnx-graph-based-on-edge-attribute
# get one color for each highway type in the graph
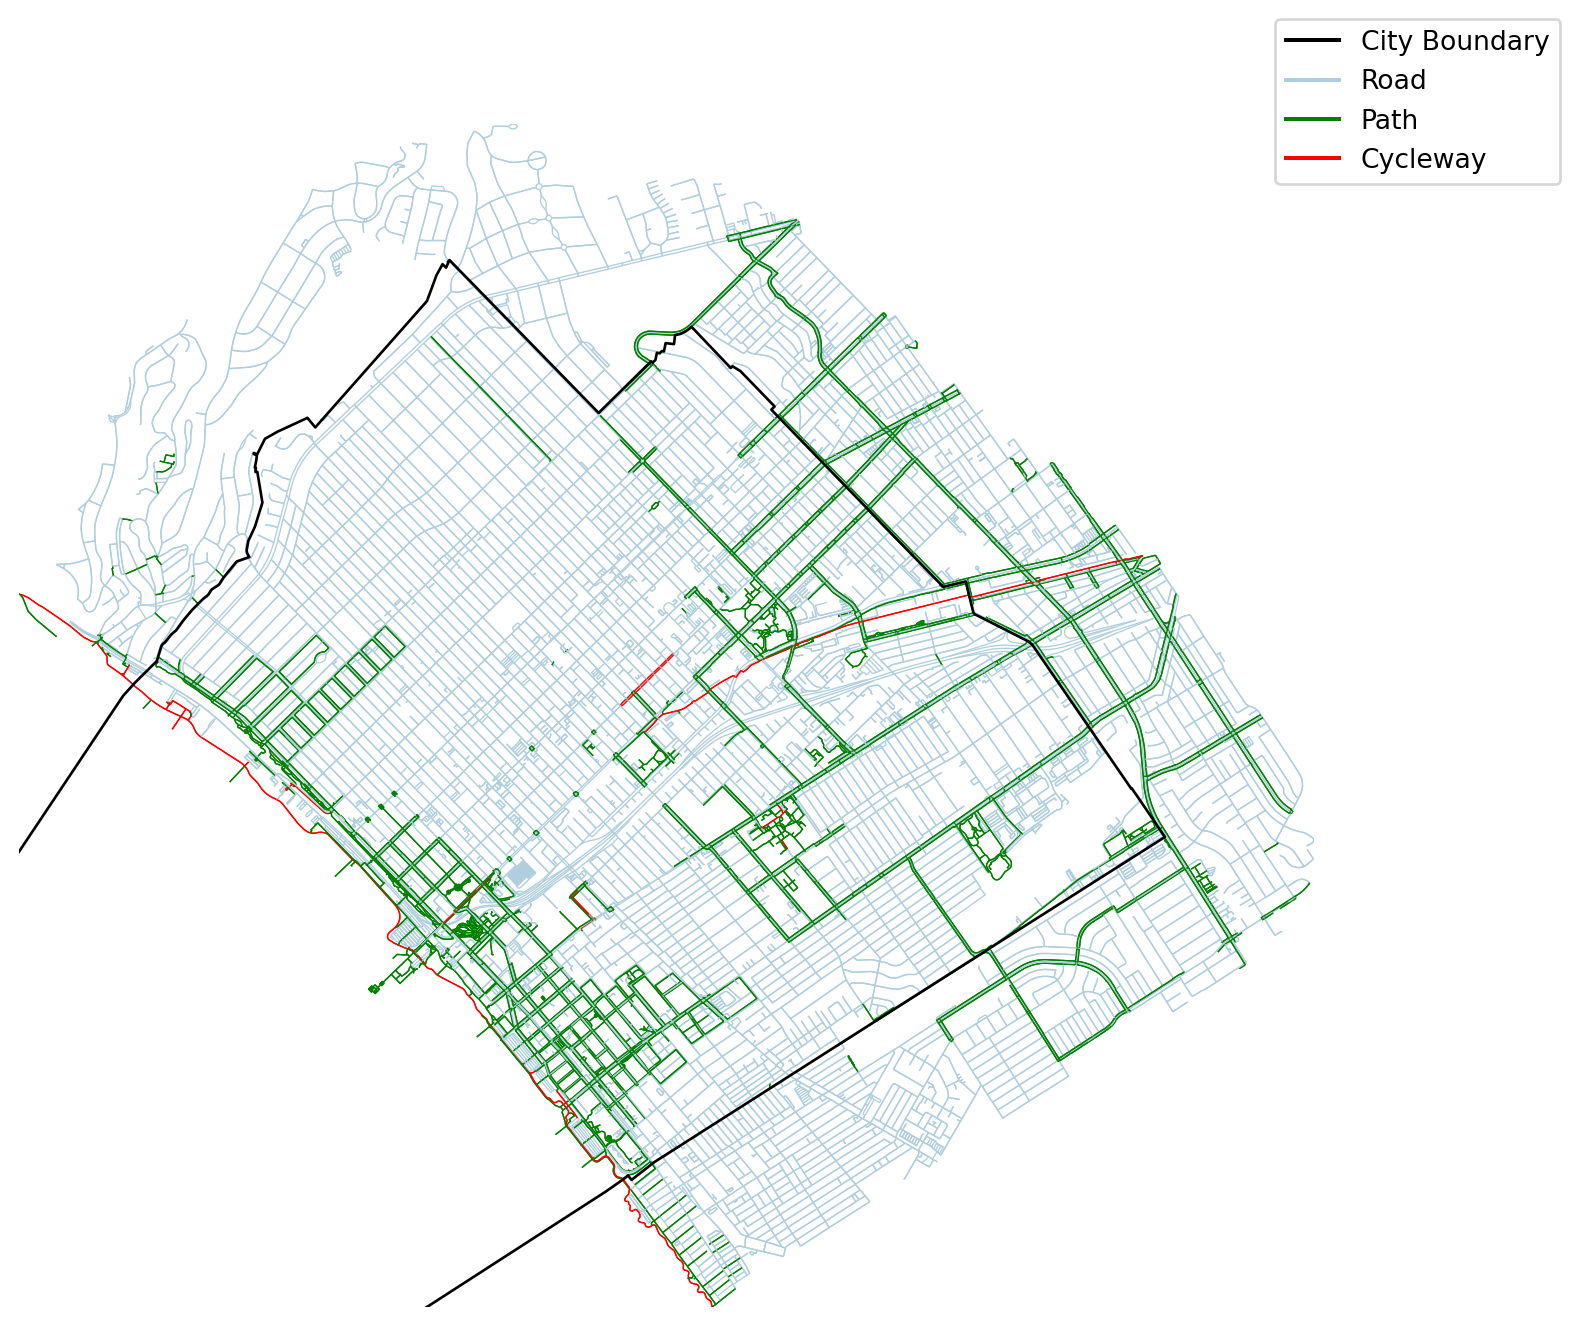
color_list = ['#B0CFDE','green','red'] #
#color_list = ox.plot.get_colors(n=len(edge_types), cmap='hsv', return_hex=True)
#color_list = ['#00e600','#ffcc99','fuchsia']
#color_list = ['#ccccff','green','magenta']
#color_list = ['white','lime','magenta']
color_mapper = pd.Series(color_list, index=edge_types.index).to_dict()
edges['color'] = edges['highway'].map(color_mapper)Plot details
# check the bounds for xlim and ylim
minx , miny , maxx , maxy = edges.total_bounds # = [-118.5250193,   33.9888725, -118.4328995,   34.0586015]

# custom legend
black_line = mlines.Line2D([], [], color='black', label='City Boundary')
blue_line = mlines.Line2D([], [], color='#B0CFDE', label='Road')
green_line = mlines.Line2D([], [], color='green', label='Path')
red_line = mlines.Line2D([], [], color='red', label='Cycleway')
fig, ax = plt.subplots(figsize=(10, 8))
edges.plot(ax=ax, color = edges['color'], linewidth=0.5, zorder=1);
boundary.plot(ax=ax, edgecolor='black', color='none', zorder=10);
ax.legend(handles=[black_line,blue_line,green_line,red_line], bbox_to_anchor=(1.2, 1.1)) #loc='lower left',
ax.set_ylim(miny, maxy)
ax.set_xlim(minx, maxx)
#ax.set_xticklabels([])
#ax.set_yticklabels([])
#ax.spines['top'].set_visible(False)
#ax.spines['right'].set_visible(False)
#ax.spines['bottom'].set_visible(False)
#ax.spines['left'].set_visible(False)
ax.axis('off')
plt.show();