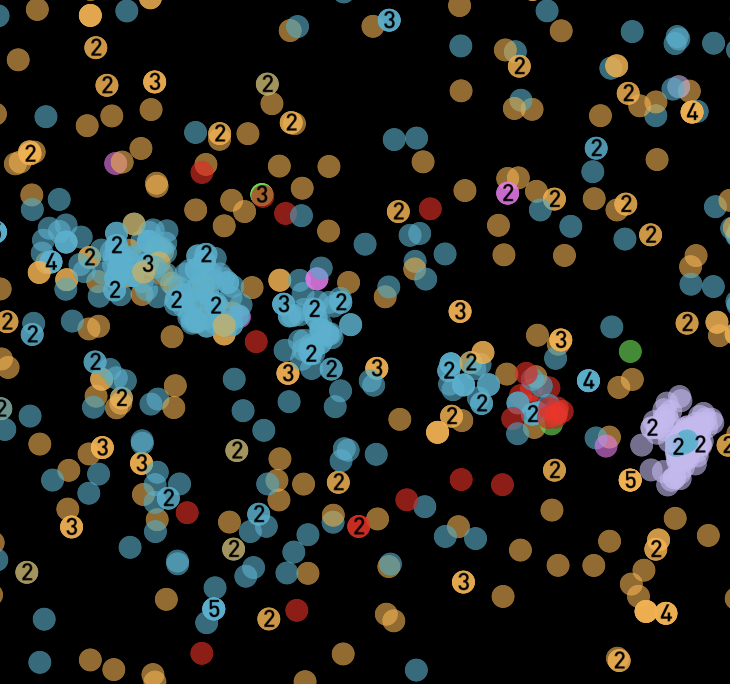
Celestial map of confirmed exoplanets relative to western constellations.
Exomap is a celestial map of exoplanets accessible via an HTML/Javascript page. Its interactivity it engages users in the discovery of exoplanets, enabling astronomy-enthusiasts to better understand the where, when, and how of exoplanet detection through their own exploration. The exoplanet data comes from NASA’s Exoplanet Archive, downloaded on March 3, 2022, as a CSV. I used Python to subset exoplanet entries recognized as having default parameters to avoid duplicate planets and calculated longitude from right ascension and latitude from declination. I used d3 to load this cleansed CSV data and build a geojson compatible with Mapbox.
Exomap does not reflect actual distances between exoplanets but rather where exoplanets appear with telescopic vision from earth. A custom black Mapbox stylesheet forms the base layer of the night sky. Layered over it is a JSON of constellations (from western culture) sourced from Olaf Frohn’s Github. The constellation background provides familiarity for users, context for the location of exoplanets appearing in the celestial sphere. This homocentric perspective of ‘looking up’ at a wider universe resonates with the theme “Local to Global” for MSc Individual Project.
Upon loading, Exomap centers on the first exoplanet discovered in 1989. As the user shifts the Mapbox time slider, the timeline of discovery plays out before them, revealing the accumulating population of exoplanets confirmed each year. Only when set at 2022 does the map enumerate overlapping exoplanet symbols, indicating exoplanets that share the same host star (i.e. identical coordinates). This emphasizes the theme “Global to Local”, as it allows users to see how among over four thousand exoplanets, some are in the same ‘neighborhood’, akin to how there are multiple planets in our solar system.
The legend on the left of the screen indicates that different exoplanet symbol hues stand for different discovery methods, the most numerous being transit and radial velocity. Observing the spatial distribution of these method categories reveals interesting local patterns, such as numerous exoplanets discovered by the transit method at the Kepler facility in the direction of the Cygnus constellation, and a smaller cluster of exoplanets detected by the microlensing method in the direction of the Sagittarius constellation.
Hovering the cursor over a planet activates a Mapbox popup with the planet name and various details. Unfortunately for co-coordinate exoplanets, a popup activates only for one planet. Overall, Exomap shows both global trends of exoplanets and specific, local details about each planet.
Sources and References NASA Exoplanet Archive: https://exoplanetarchive.ipac.caltech.edu/, https://exoplanetarchive.ipac.caltech.edu/docs/API_PS_columns.html Celestial Background Map Source: https://github.com/ofrohn/d3-celestial/blob/master/data/constellations.lines.json, https://github.com/ofrohn/d3-celestial/blob/master/data/constellations.json Converting longitude from right ascension: https://sciencing.com/calculate-longitude-right-ascension-6742230.html Build GeoJSON with D3.JS: CASA0003 Time Slider: https://docs.mapbox.com/mapbox-gl-js/example/timeline-animation/ Planet Clusters: https://docs.mapbox.com/mapbox-gl-js/example/cluster/ Legend: https://docs.mapbox.com/help/tutorials/choropleth-studio-gl-pt-2/ Popup: https://docs.mapbox.com/mapbox-gl-js/example/popup-on-hover/, https://gis.stackexchange.com/questions/253694/combining-popup-info-from-overlapping-polygons-in-mapbox-gl-js